Why we create Omics3D
Introduction of Omcis3D
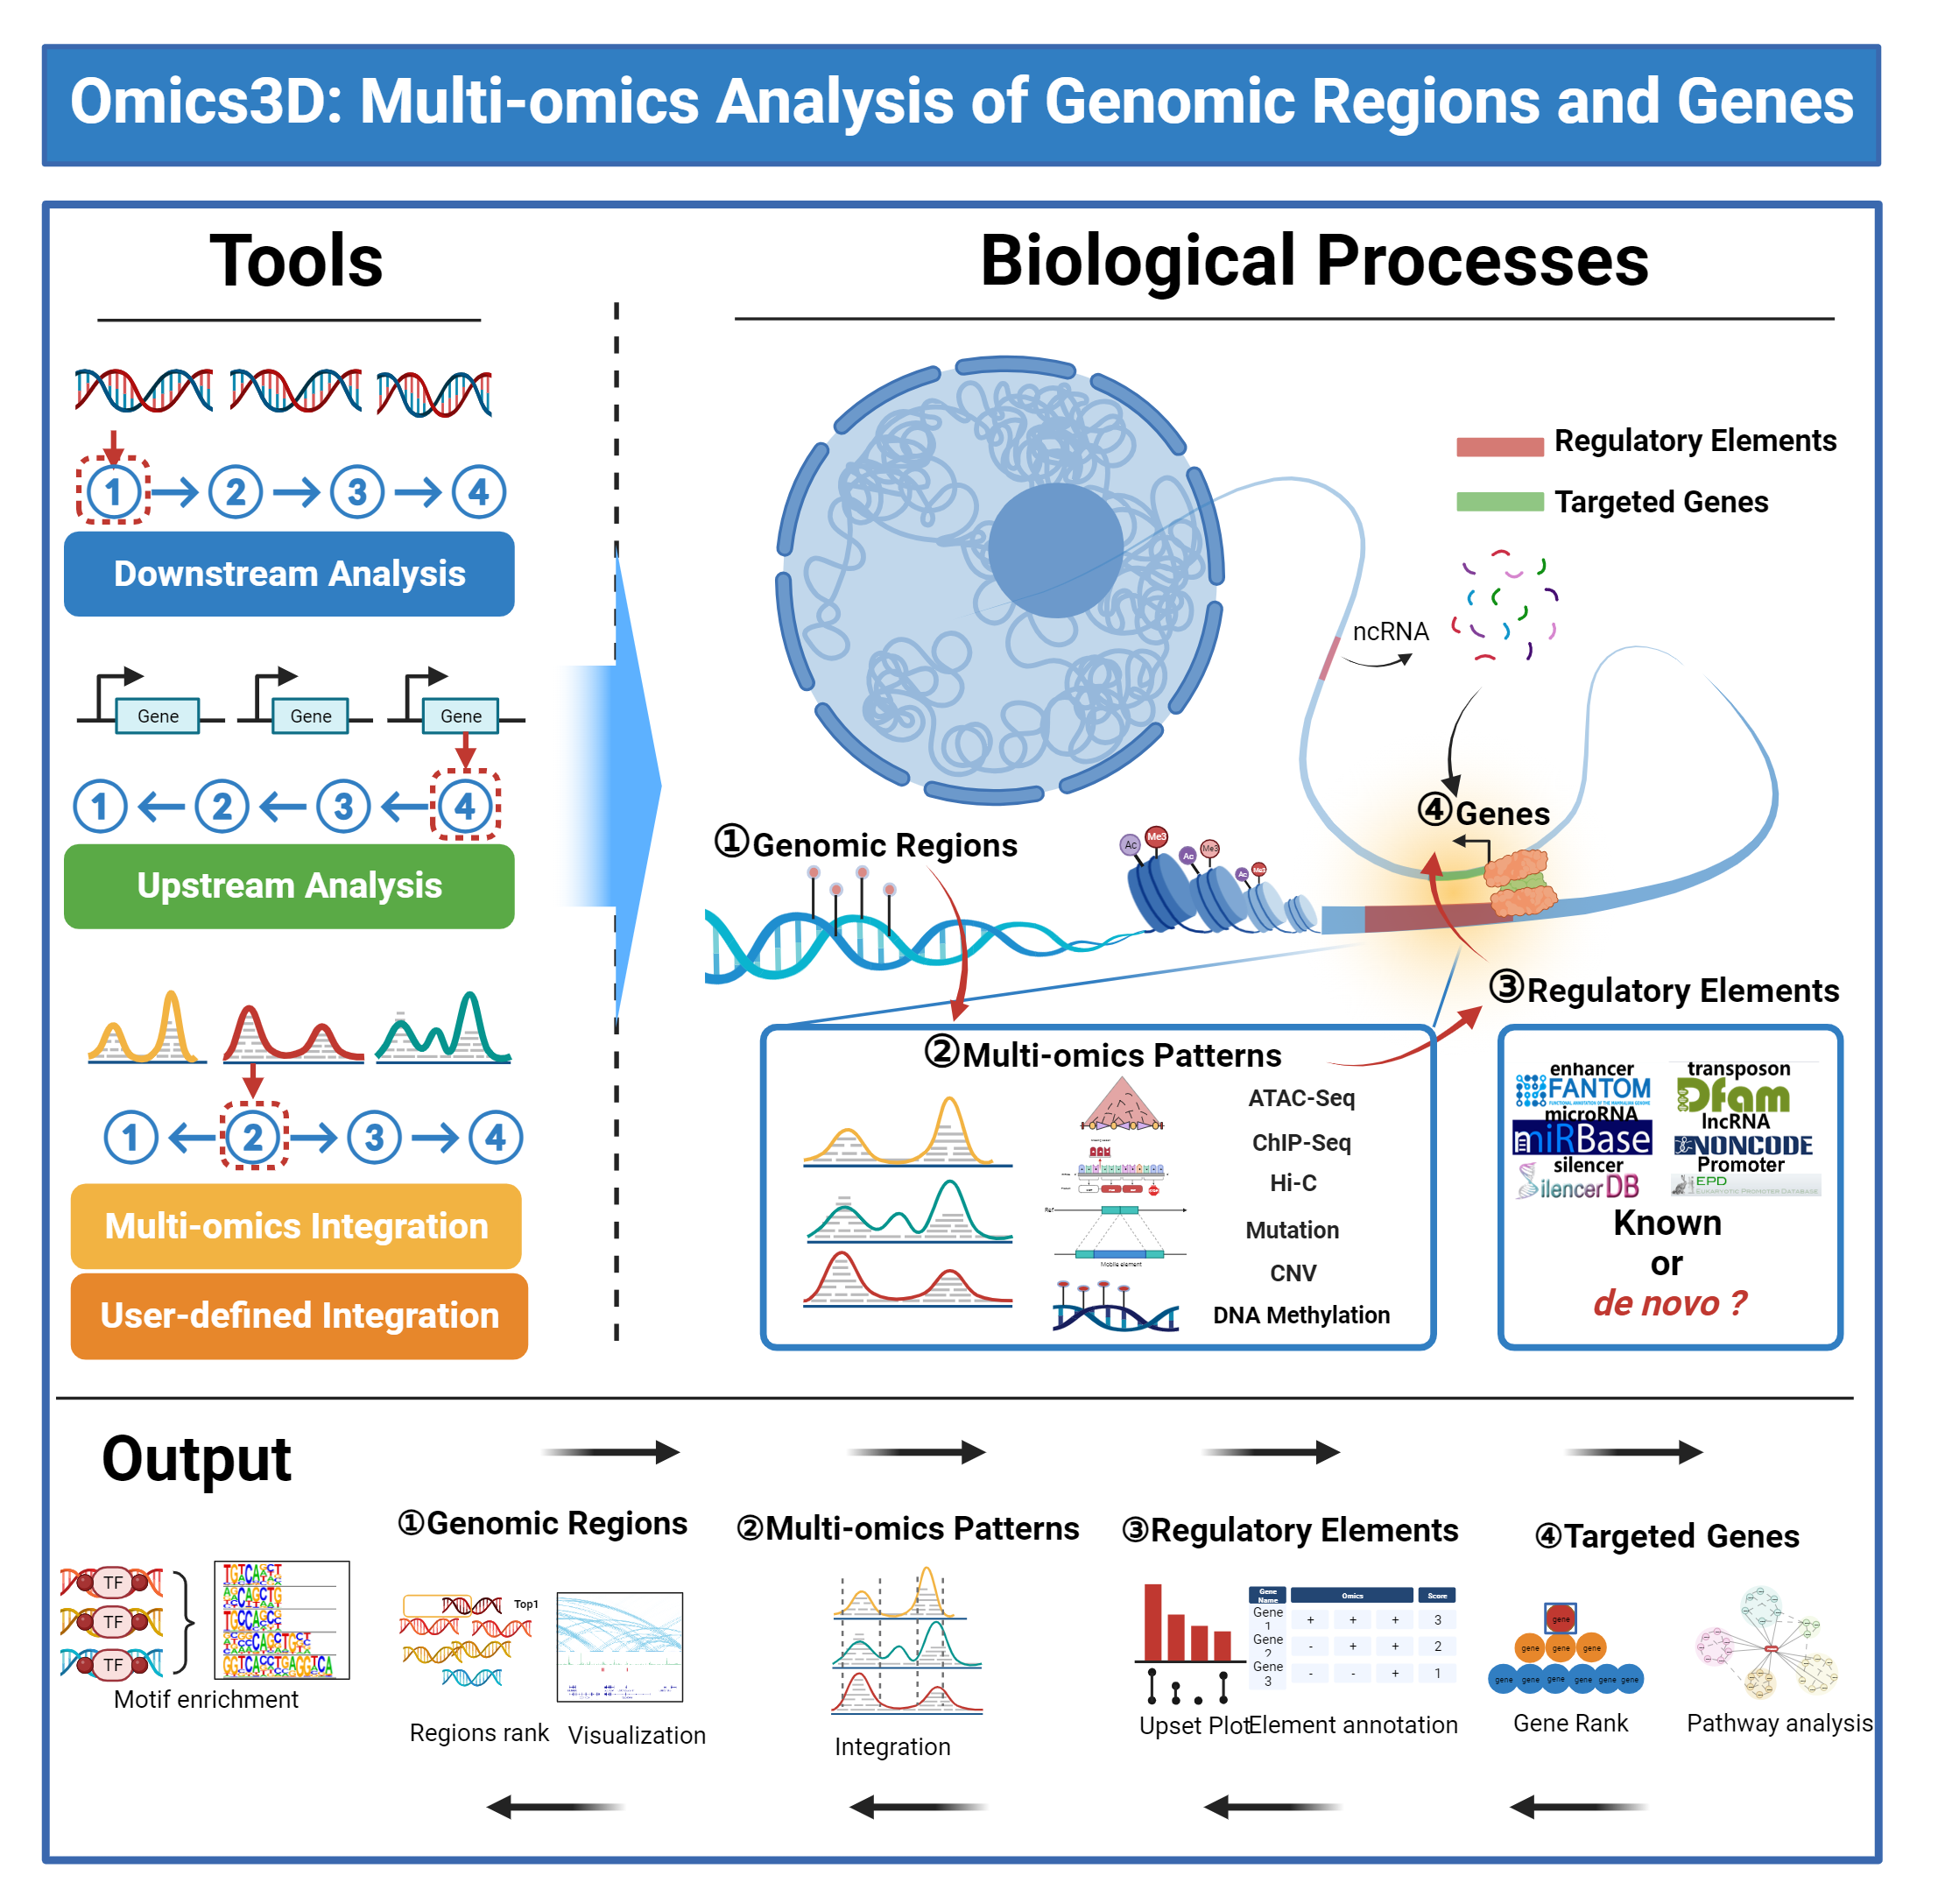
1) Downstream Analysis: Online analysis of the downstream factors of their interested genomic regions, including the multi-omics patterns and the regulatory elements of genomic regions, and their potentially regulated genes.
2) Upstream Analysis: Online analysis of the upstream factors of their interested genes, including the regulatory elements and the multi-omics patterns of genes, and their potentially associated genomic regions.
3) Multi-omics Integration: Online multi-omics analysis by integrating different types of omics data using their data with or without Omics3D data.
4) User-defined Integration: Online multi-omics analysis by integrating different species using their data with or without Omics3D data.
1) Repository: It was developed as a multi-omics database to describe genomic regions, multi-omics patterns, regulatory elements, and related genes.
2) Download: It was developed to get pre-generated genome-wide and multi-omics analyses, helping to screen genomic regions and candidate genes.
3) Browser Visualization: It was developed to visualize multiple omics data.
4) AI Chat: It was developed to interpret multiple omics data.
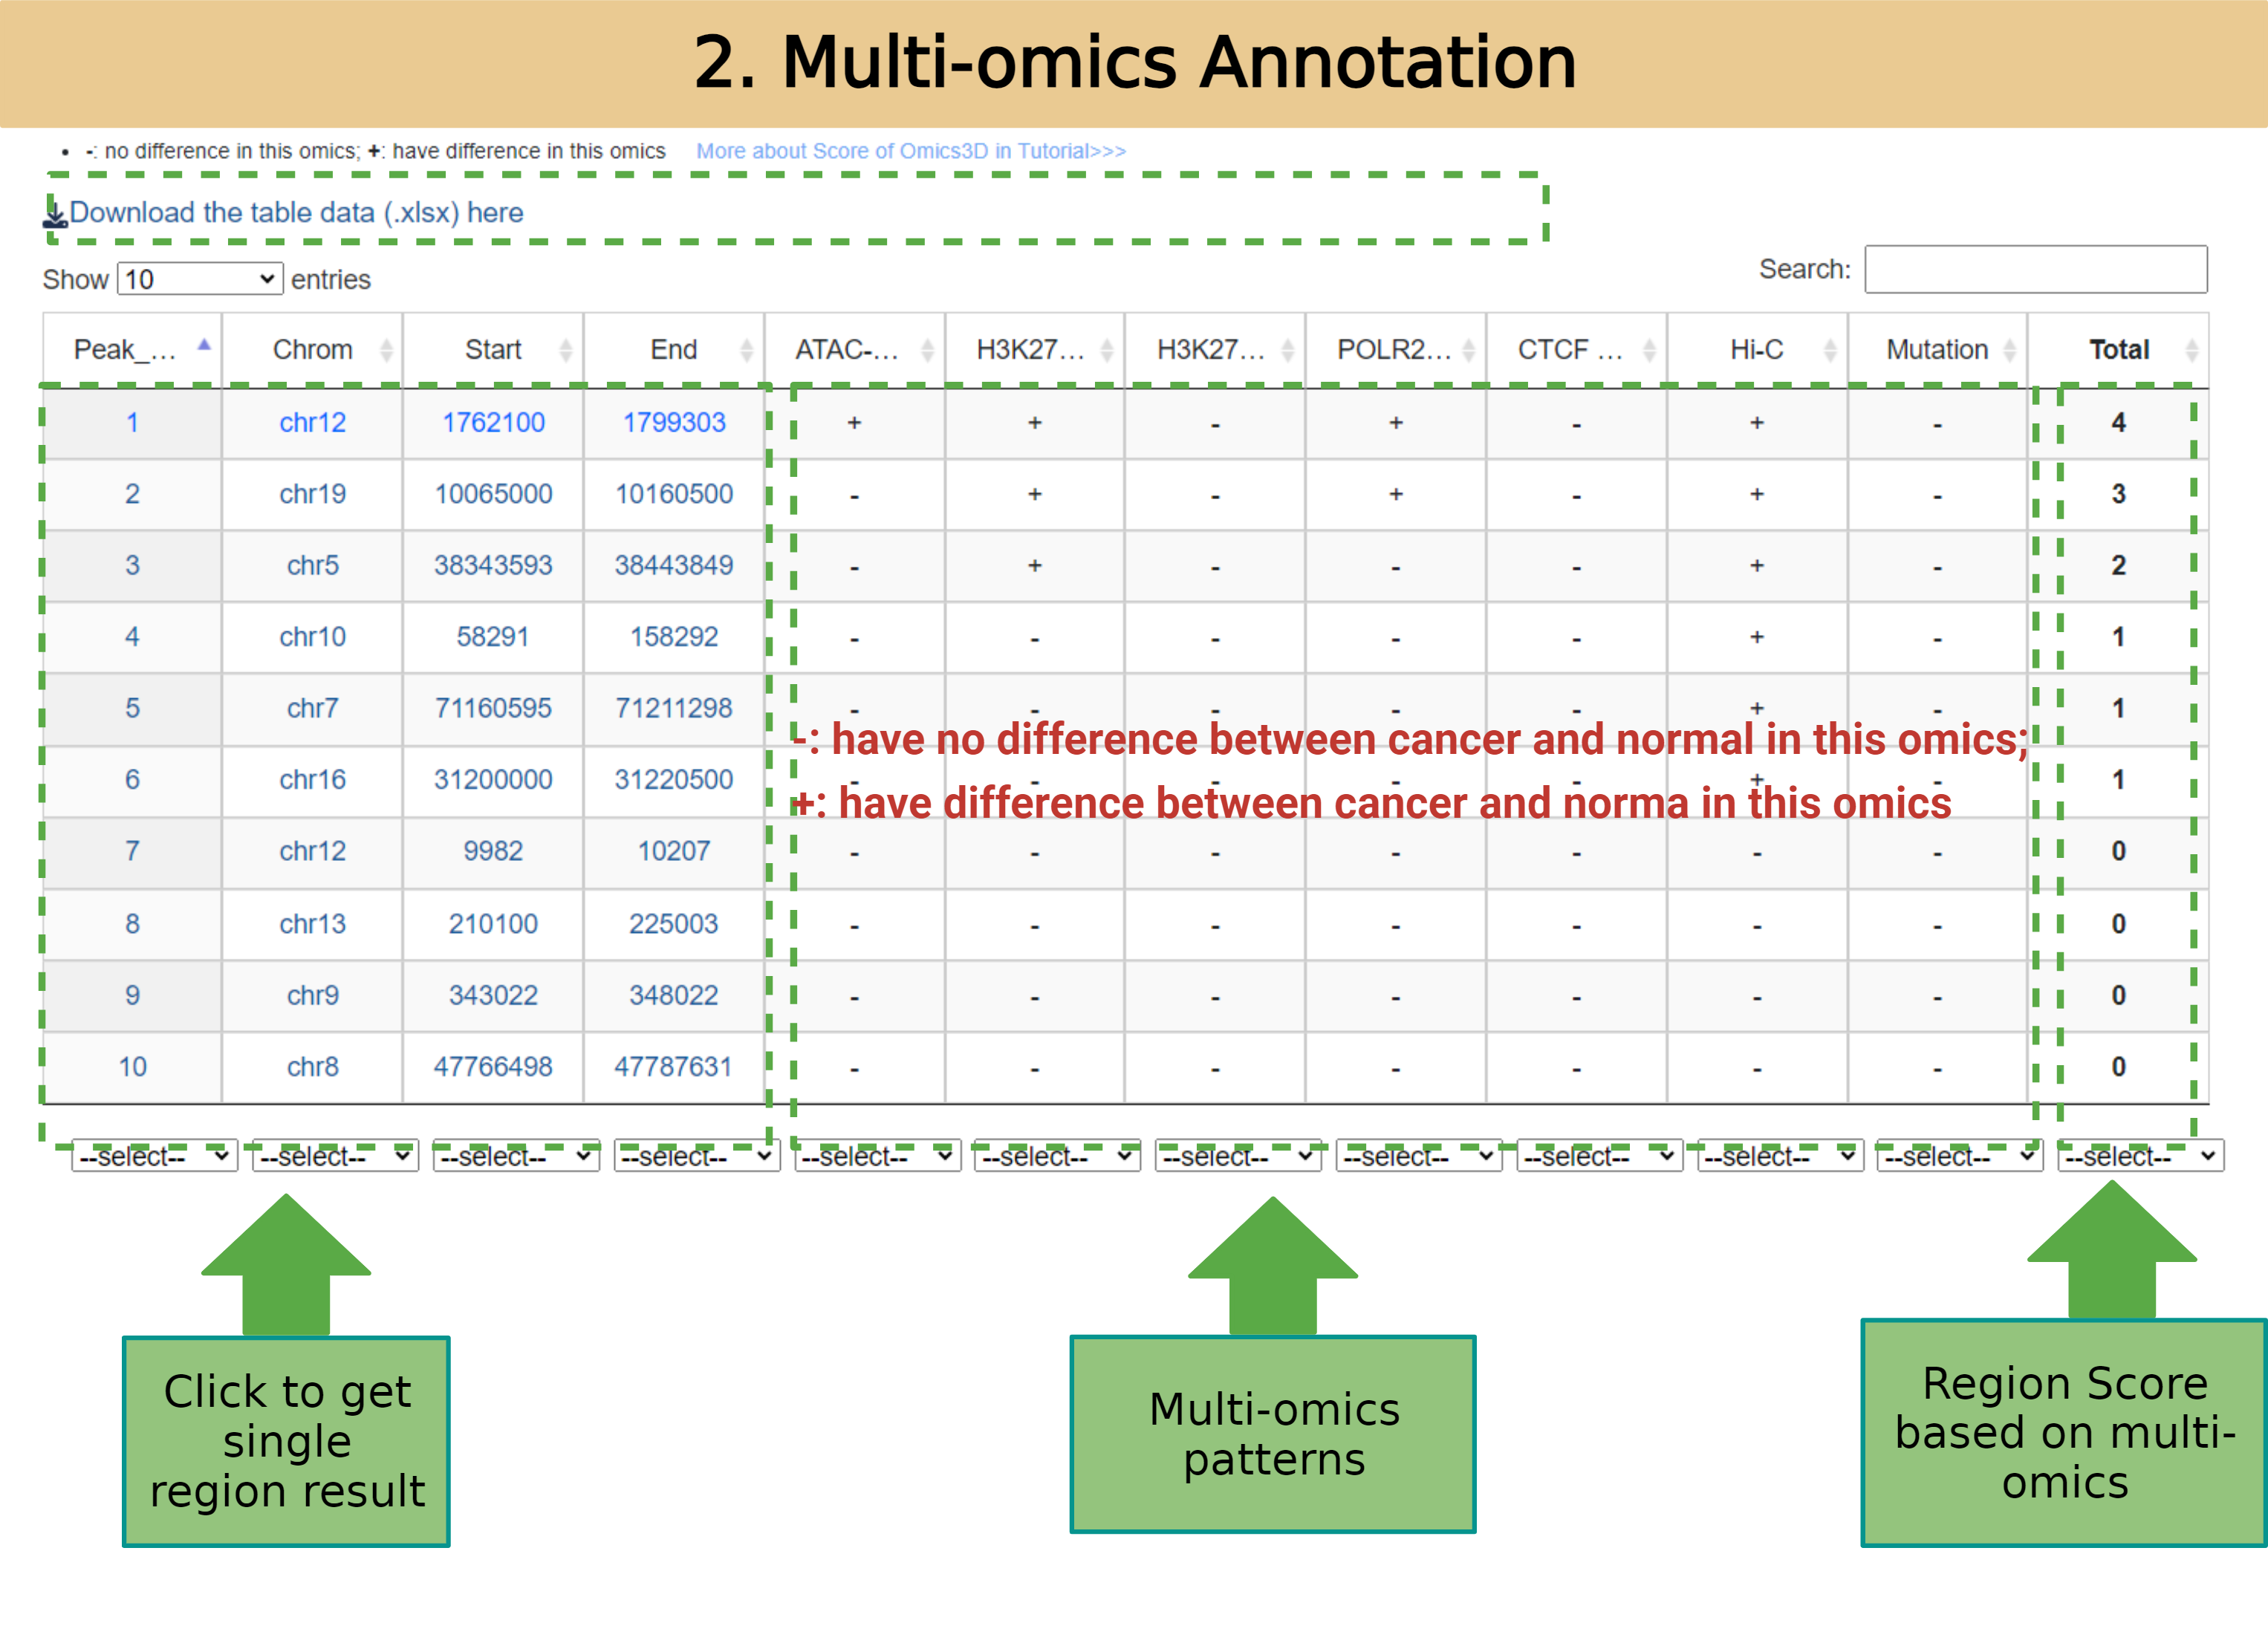
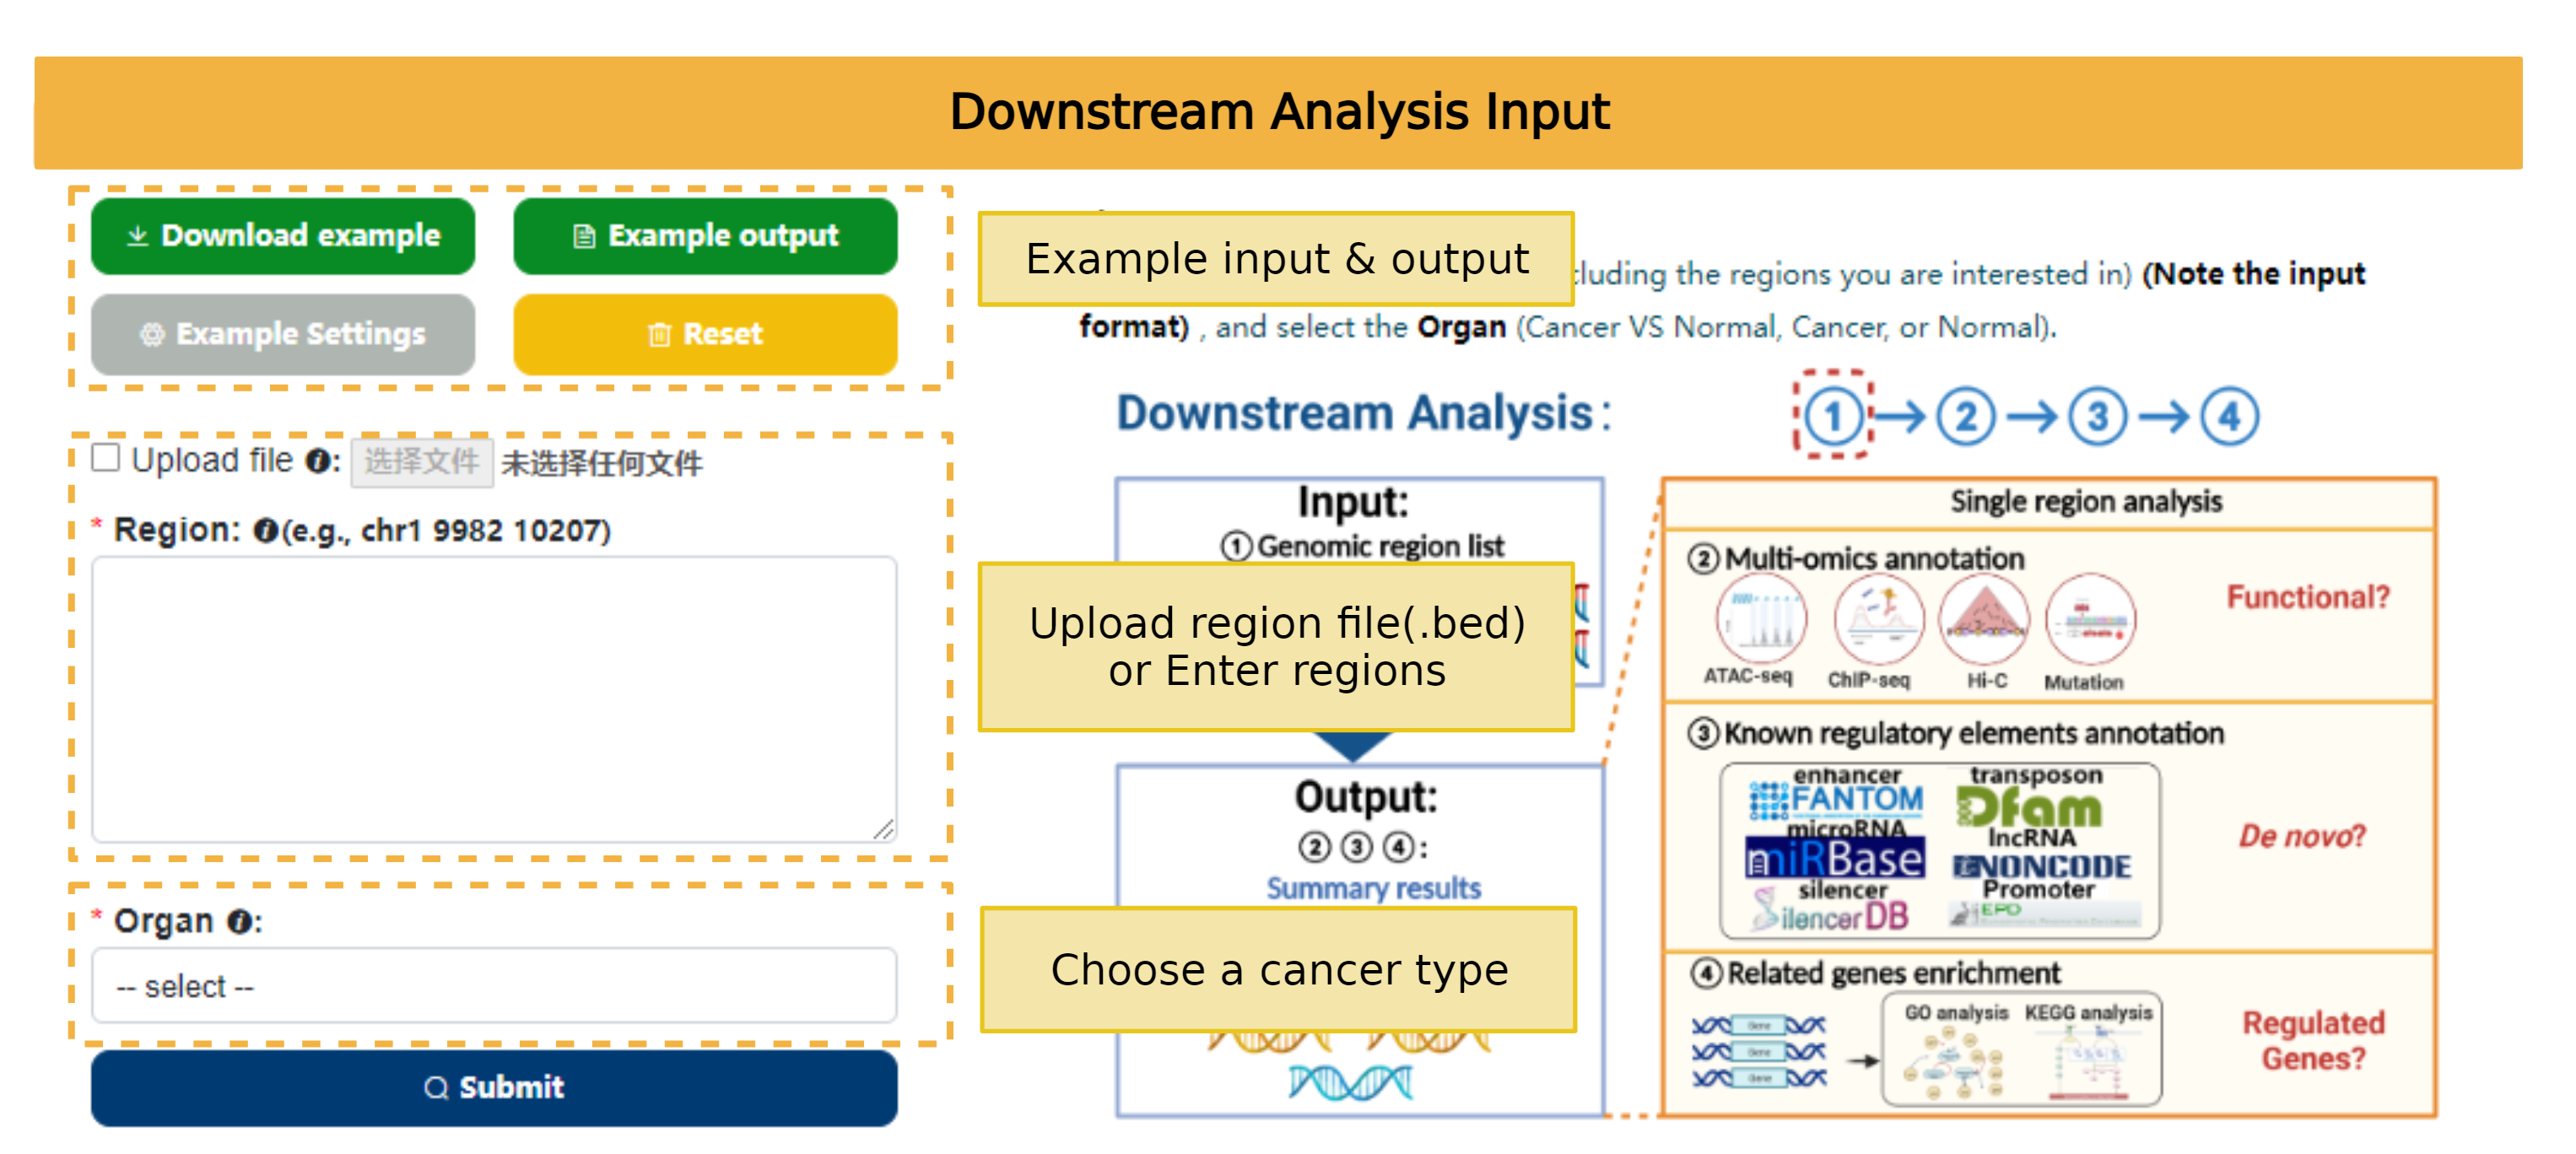
The Downstream analysis tool helps users to select potential genomic regions that are more suitable for reAnalysis through multiple omics annotation and regulatory element annotation analysis of 7 tumors with high incidence and mortality based on their regions of interest.
The result page will be redirected automatically, and users can view it through the Job URL within 30 days.


Reference of regulatory elements:
Promoter:
Enhancer:
https://fantom.gsc.riken.jp/5/datafiles/latest/extra/Enhancers/s
Silencer:
http://health.tsinghua.edu.cn/silencerdb/download.php
Transposon:
https://dfam.org/releases/Dfam_3.7/annotations/hg38/
MicorRNA:
lncRNA:
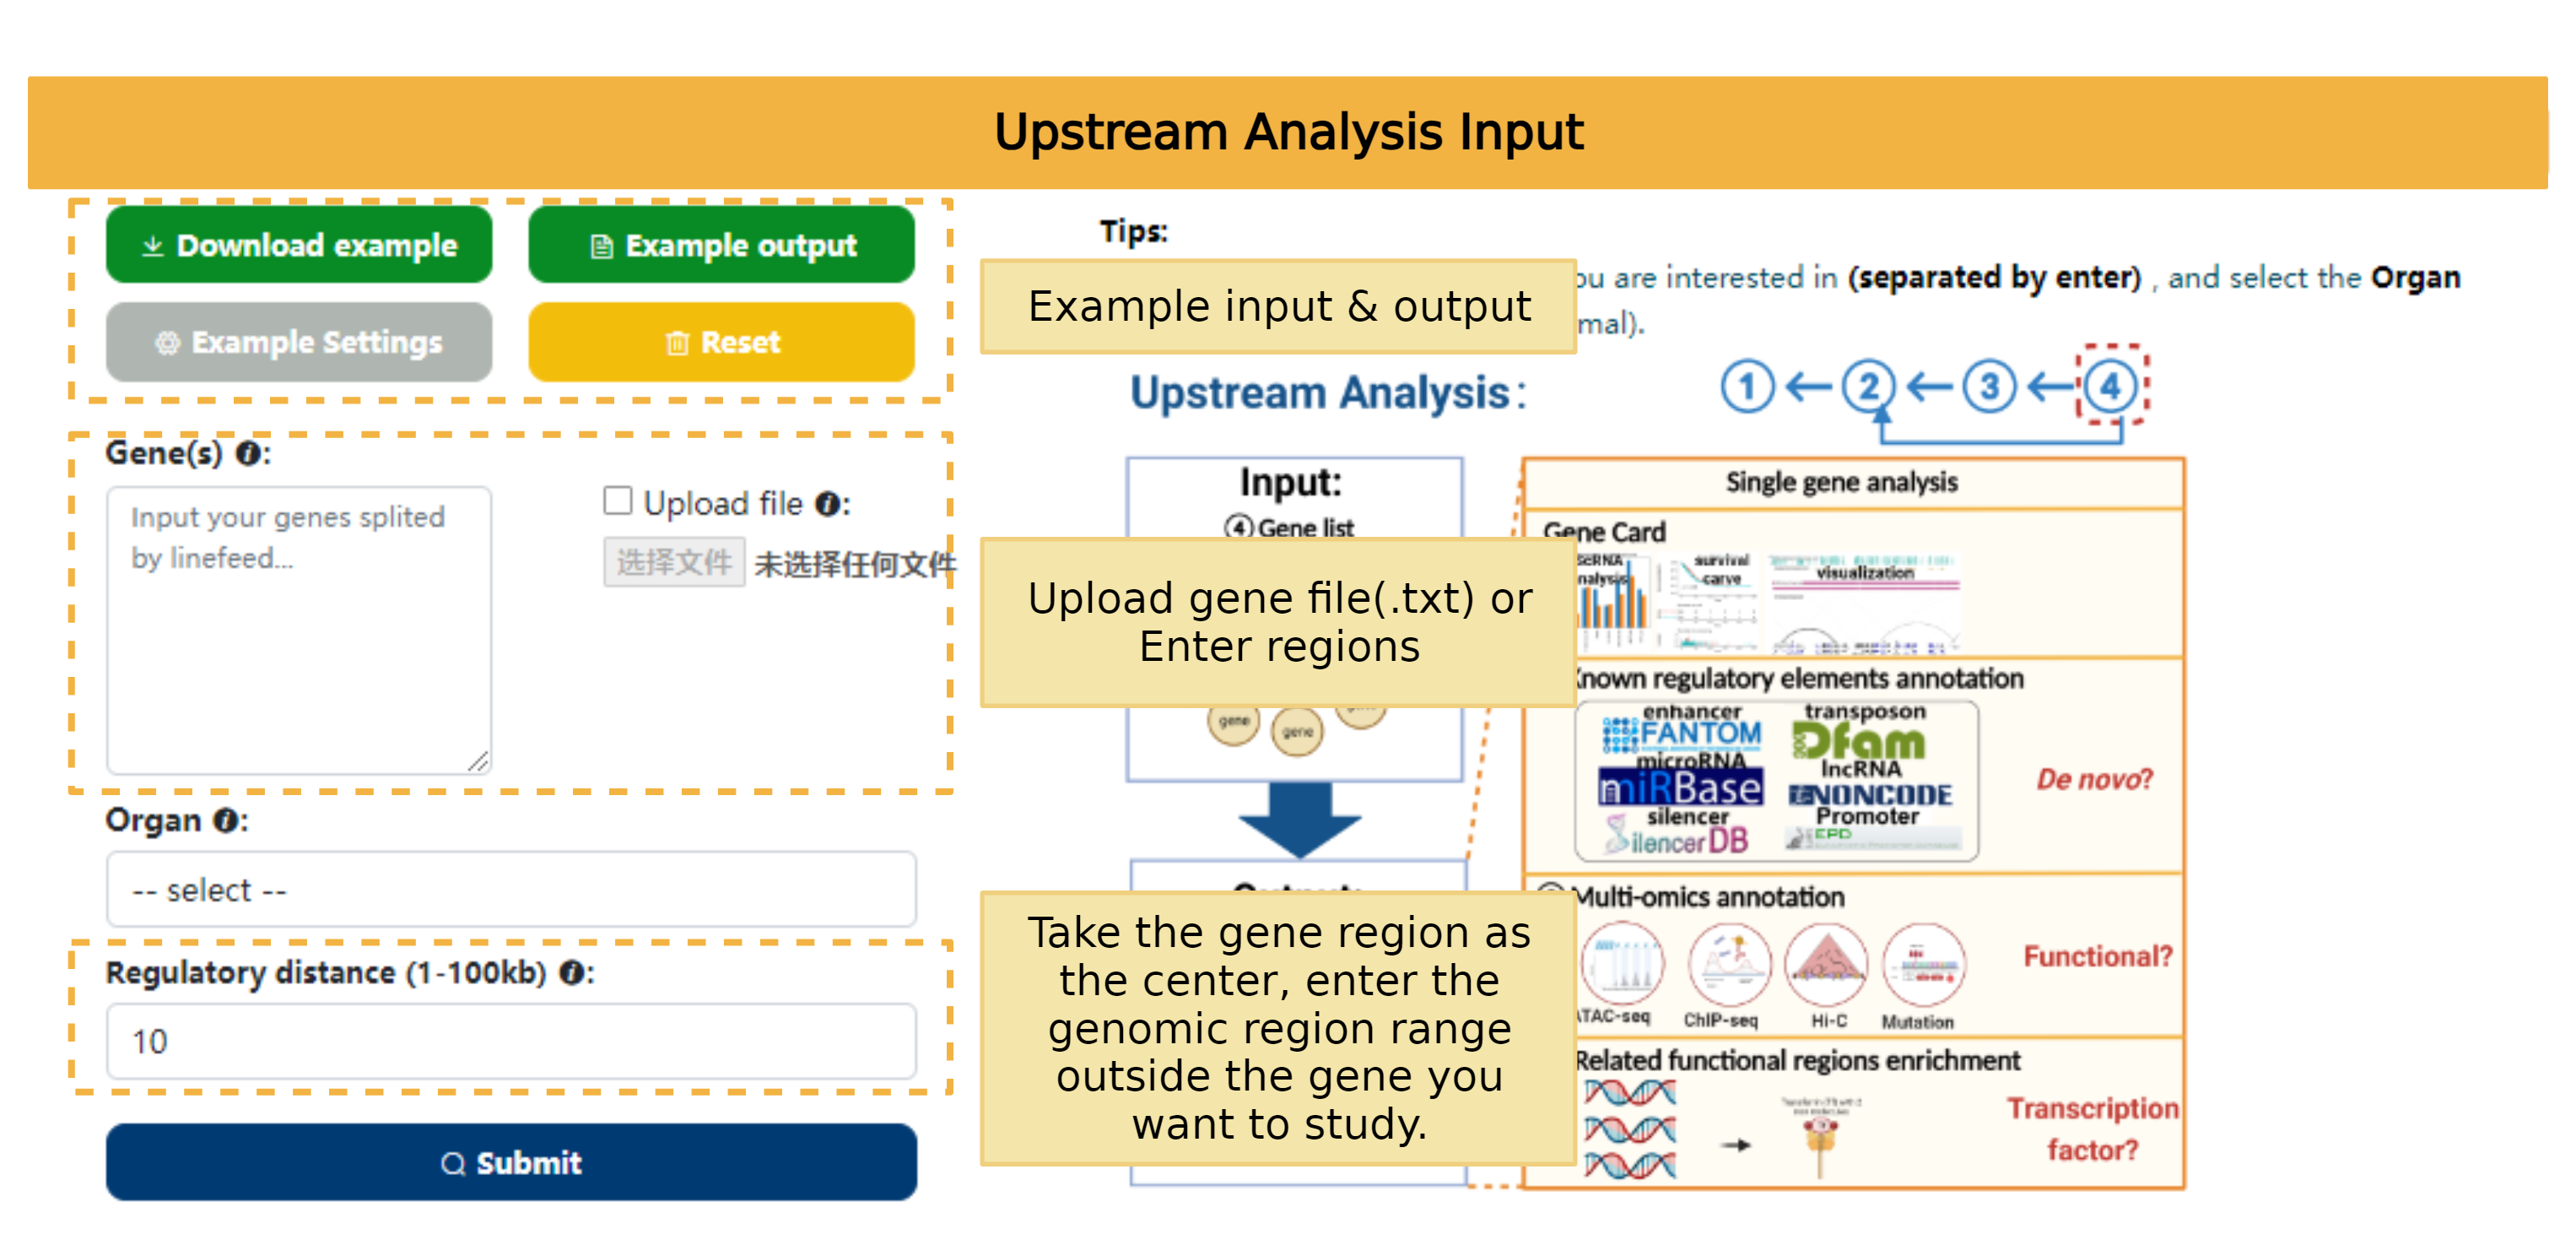
Upstream analysis tool help user to analyze potential relationship of input genes with 8 omics. Users can select different zone to explore their interested genes: Cancer VS Normal, Cancer or Normal of the selected organ. Users can choose to input their interested genes by typing in or select a file in which genes are separated by enter. If users have any questions about input, they can click example and the website will provide a example input for users.
The result page will be redirected automatically, and users can view it through the Job URL within 30 days.


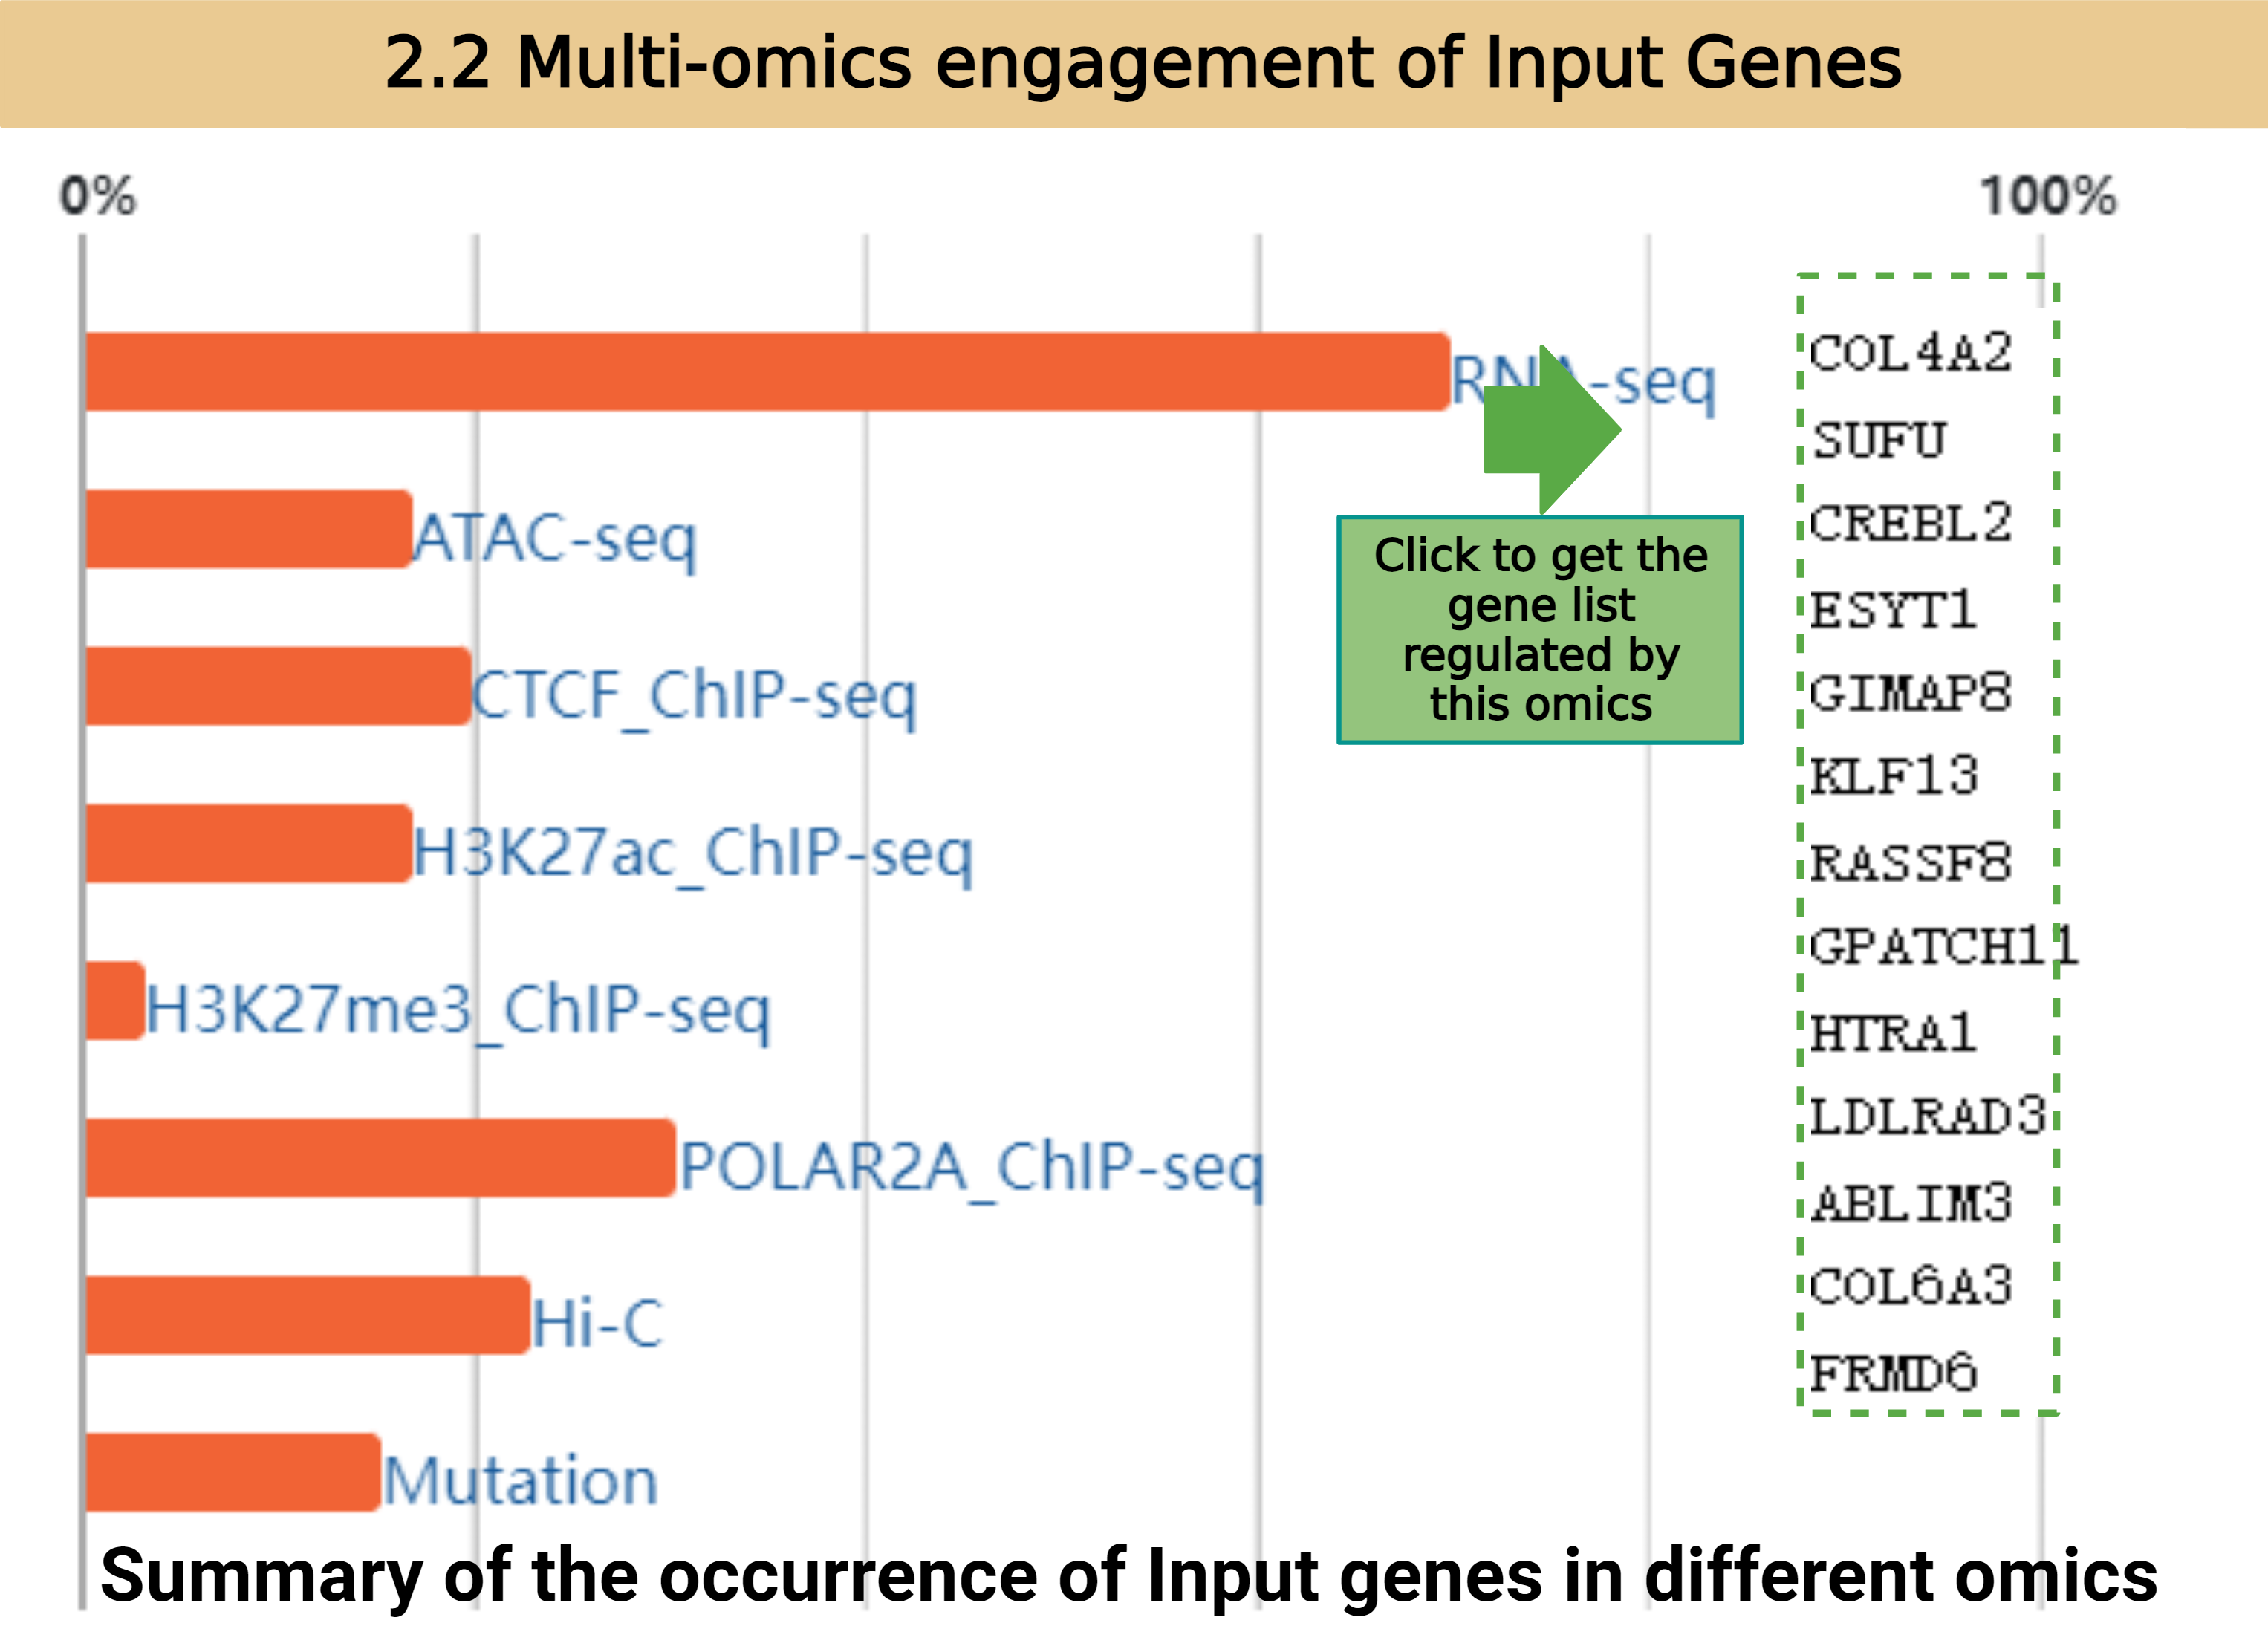

In this part we annotate and cluster input genes into functional annotations. We put input genes into one functional annotation when they are overlapped with the full gene list of that annotation. All functional annotations are defined as follows: we use DEGs of Cancer VS Normal/expressed genes in Cancer/expressed genes in Normal (this is up to the Organ selection) to do GO&KEGG analysis. The returned pathways with p-value less than 0.05 are collected as functional annotation reference. The enriched genes of each pathway are defined as the full gene list of the corresponding functional annotation.
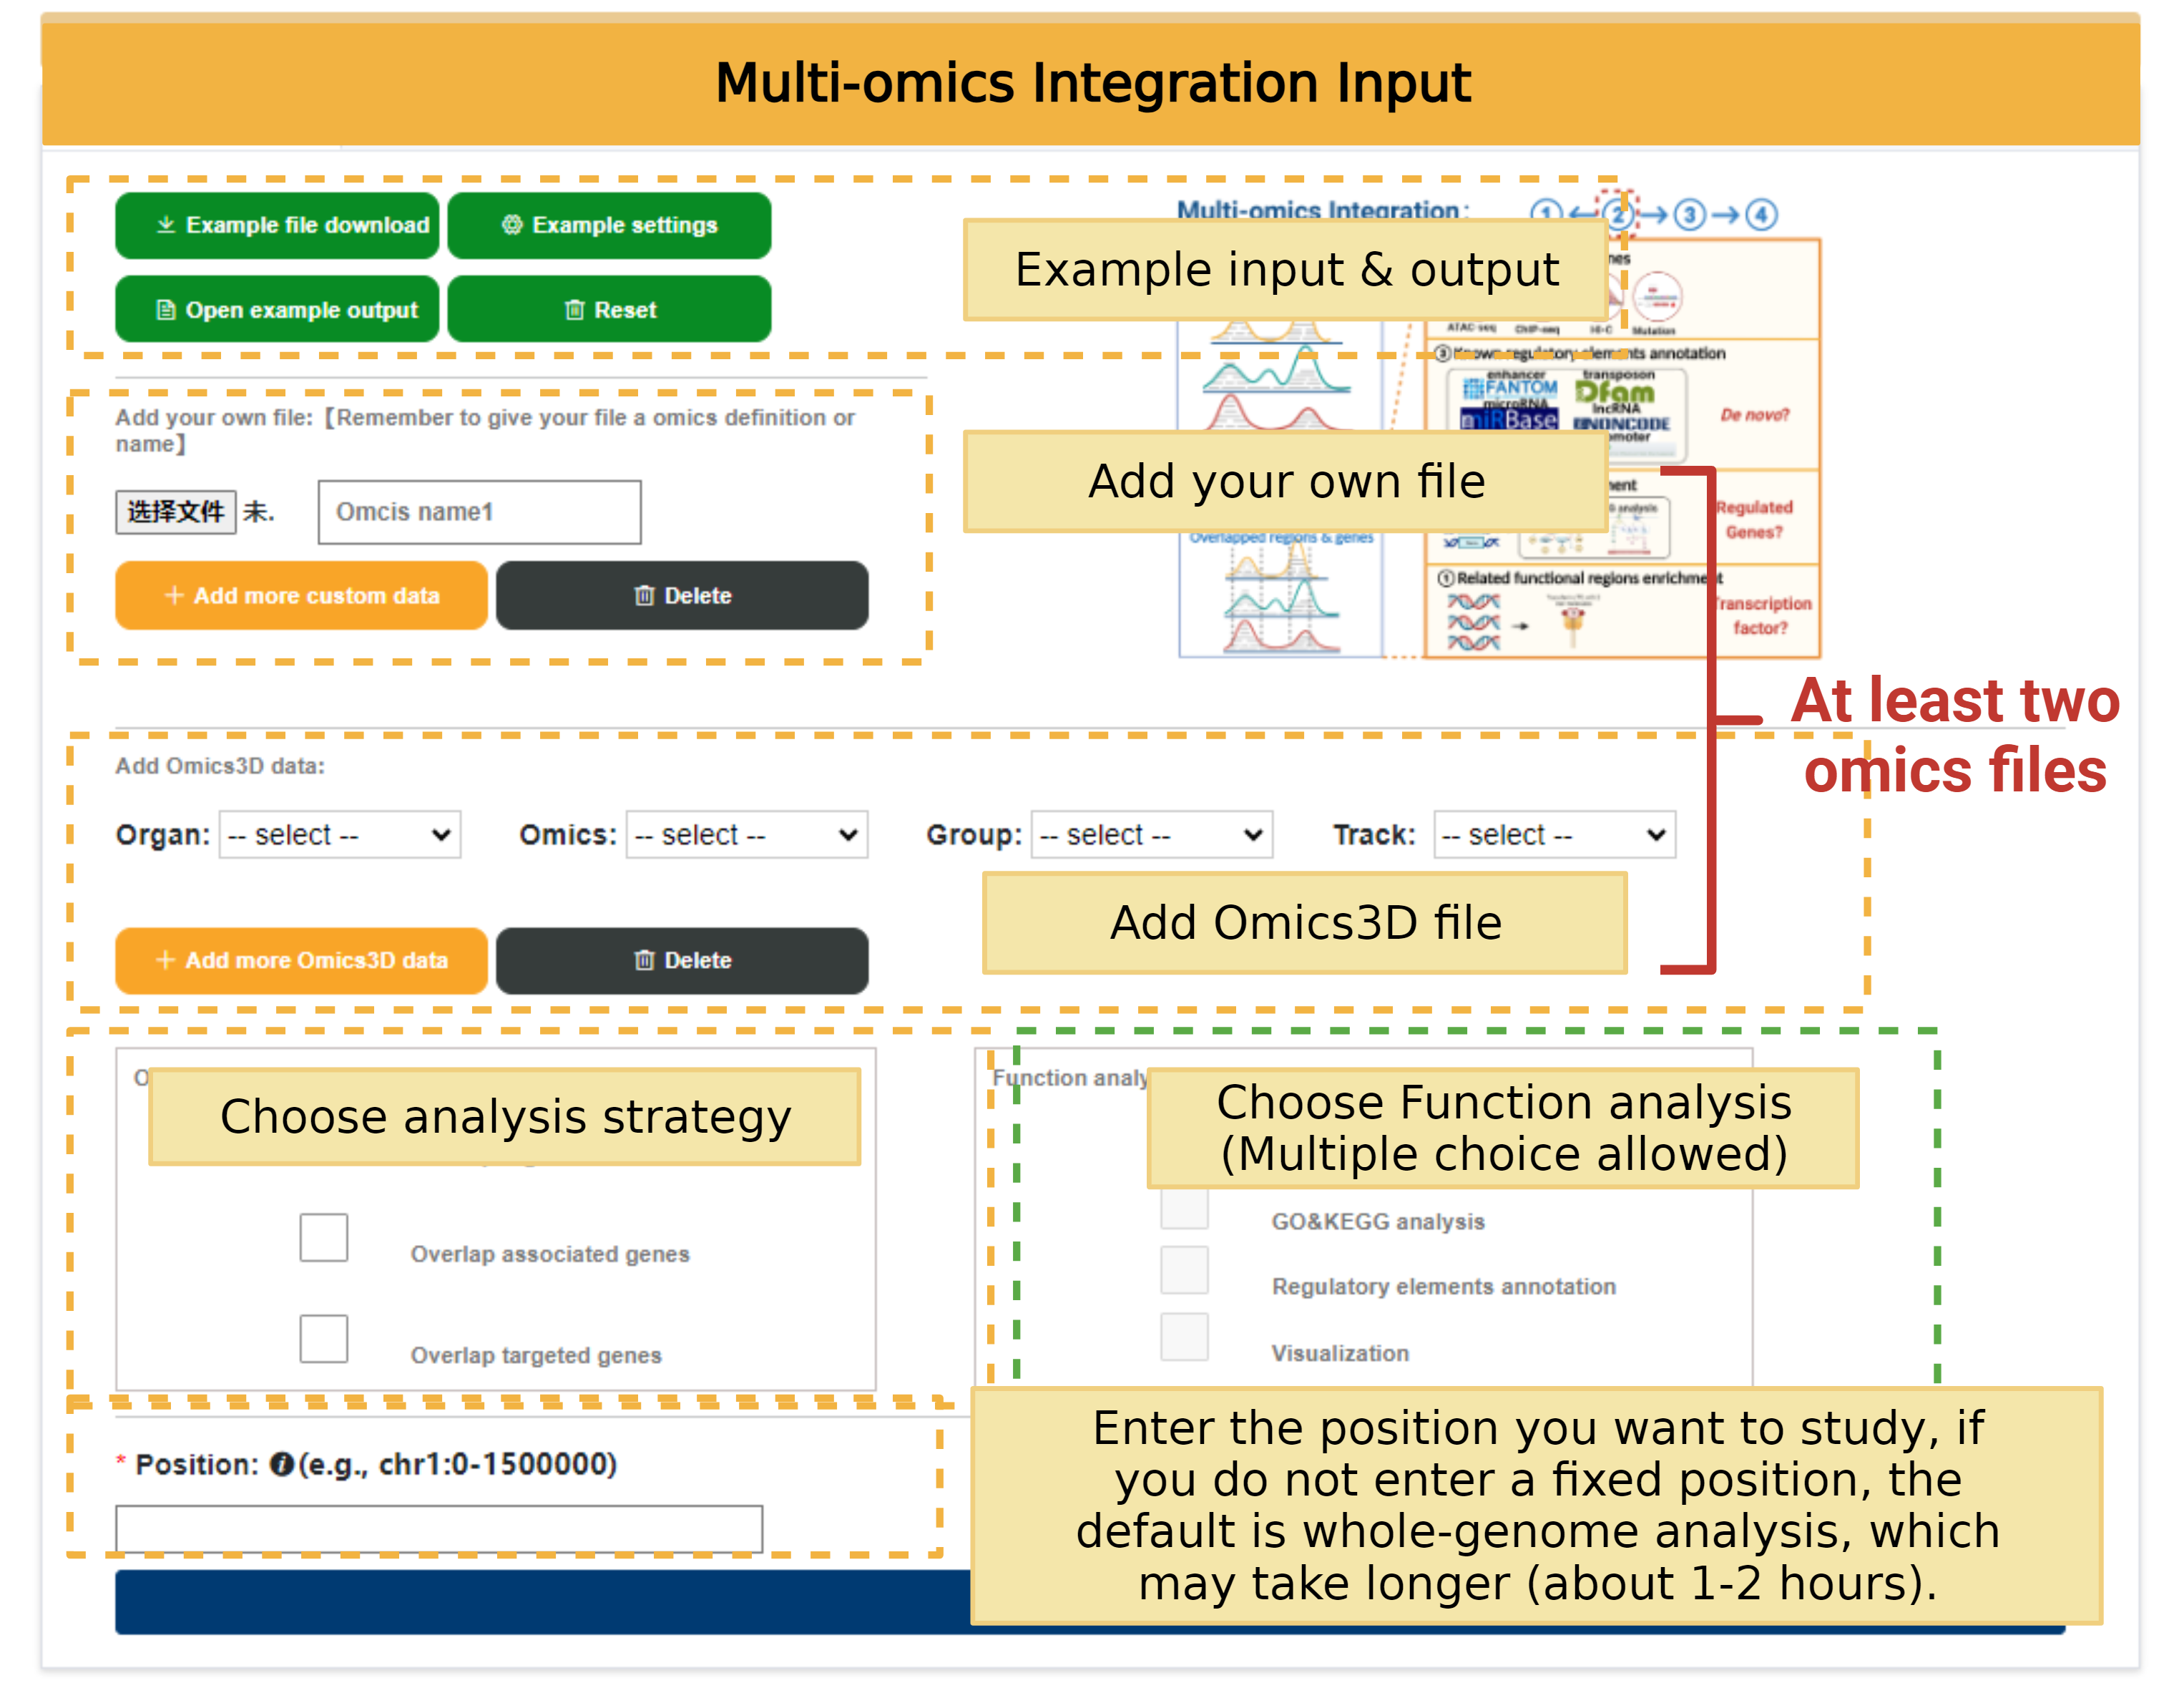
The form page for user to upload their data or choose the data they are interested in for further analysis.
The result page will generated in few minutes after submitting the files.
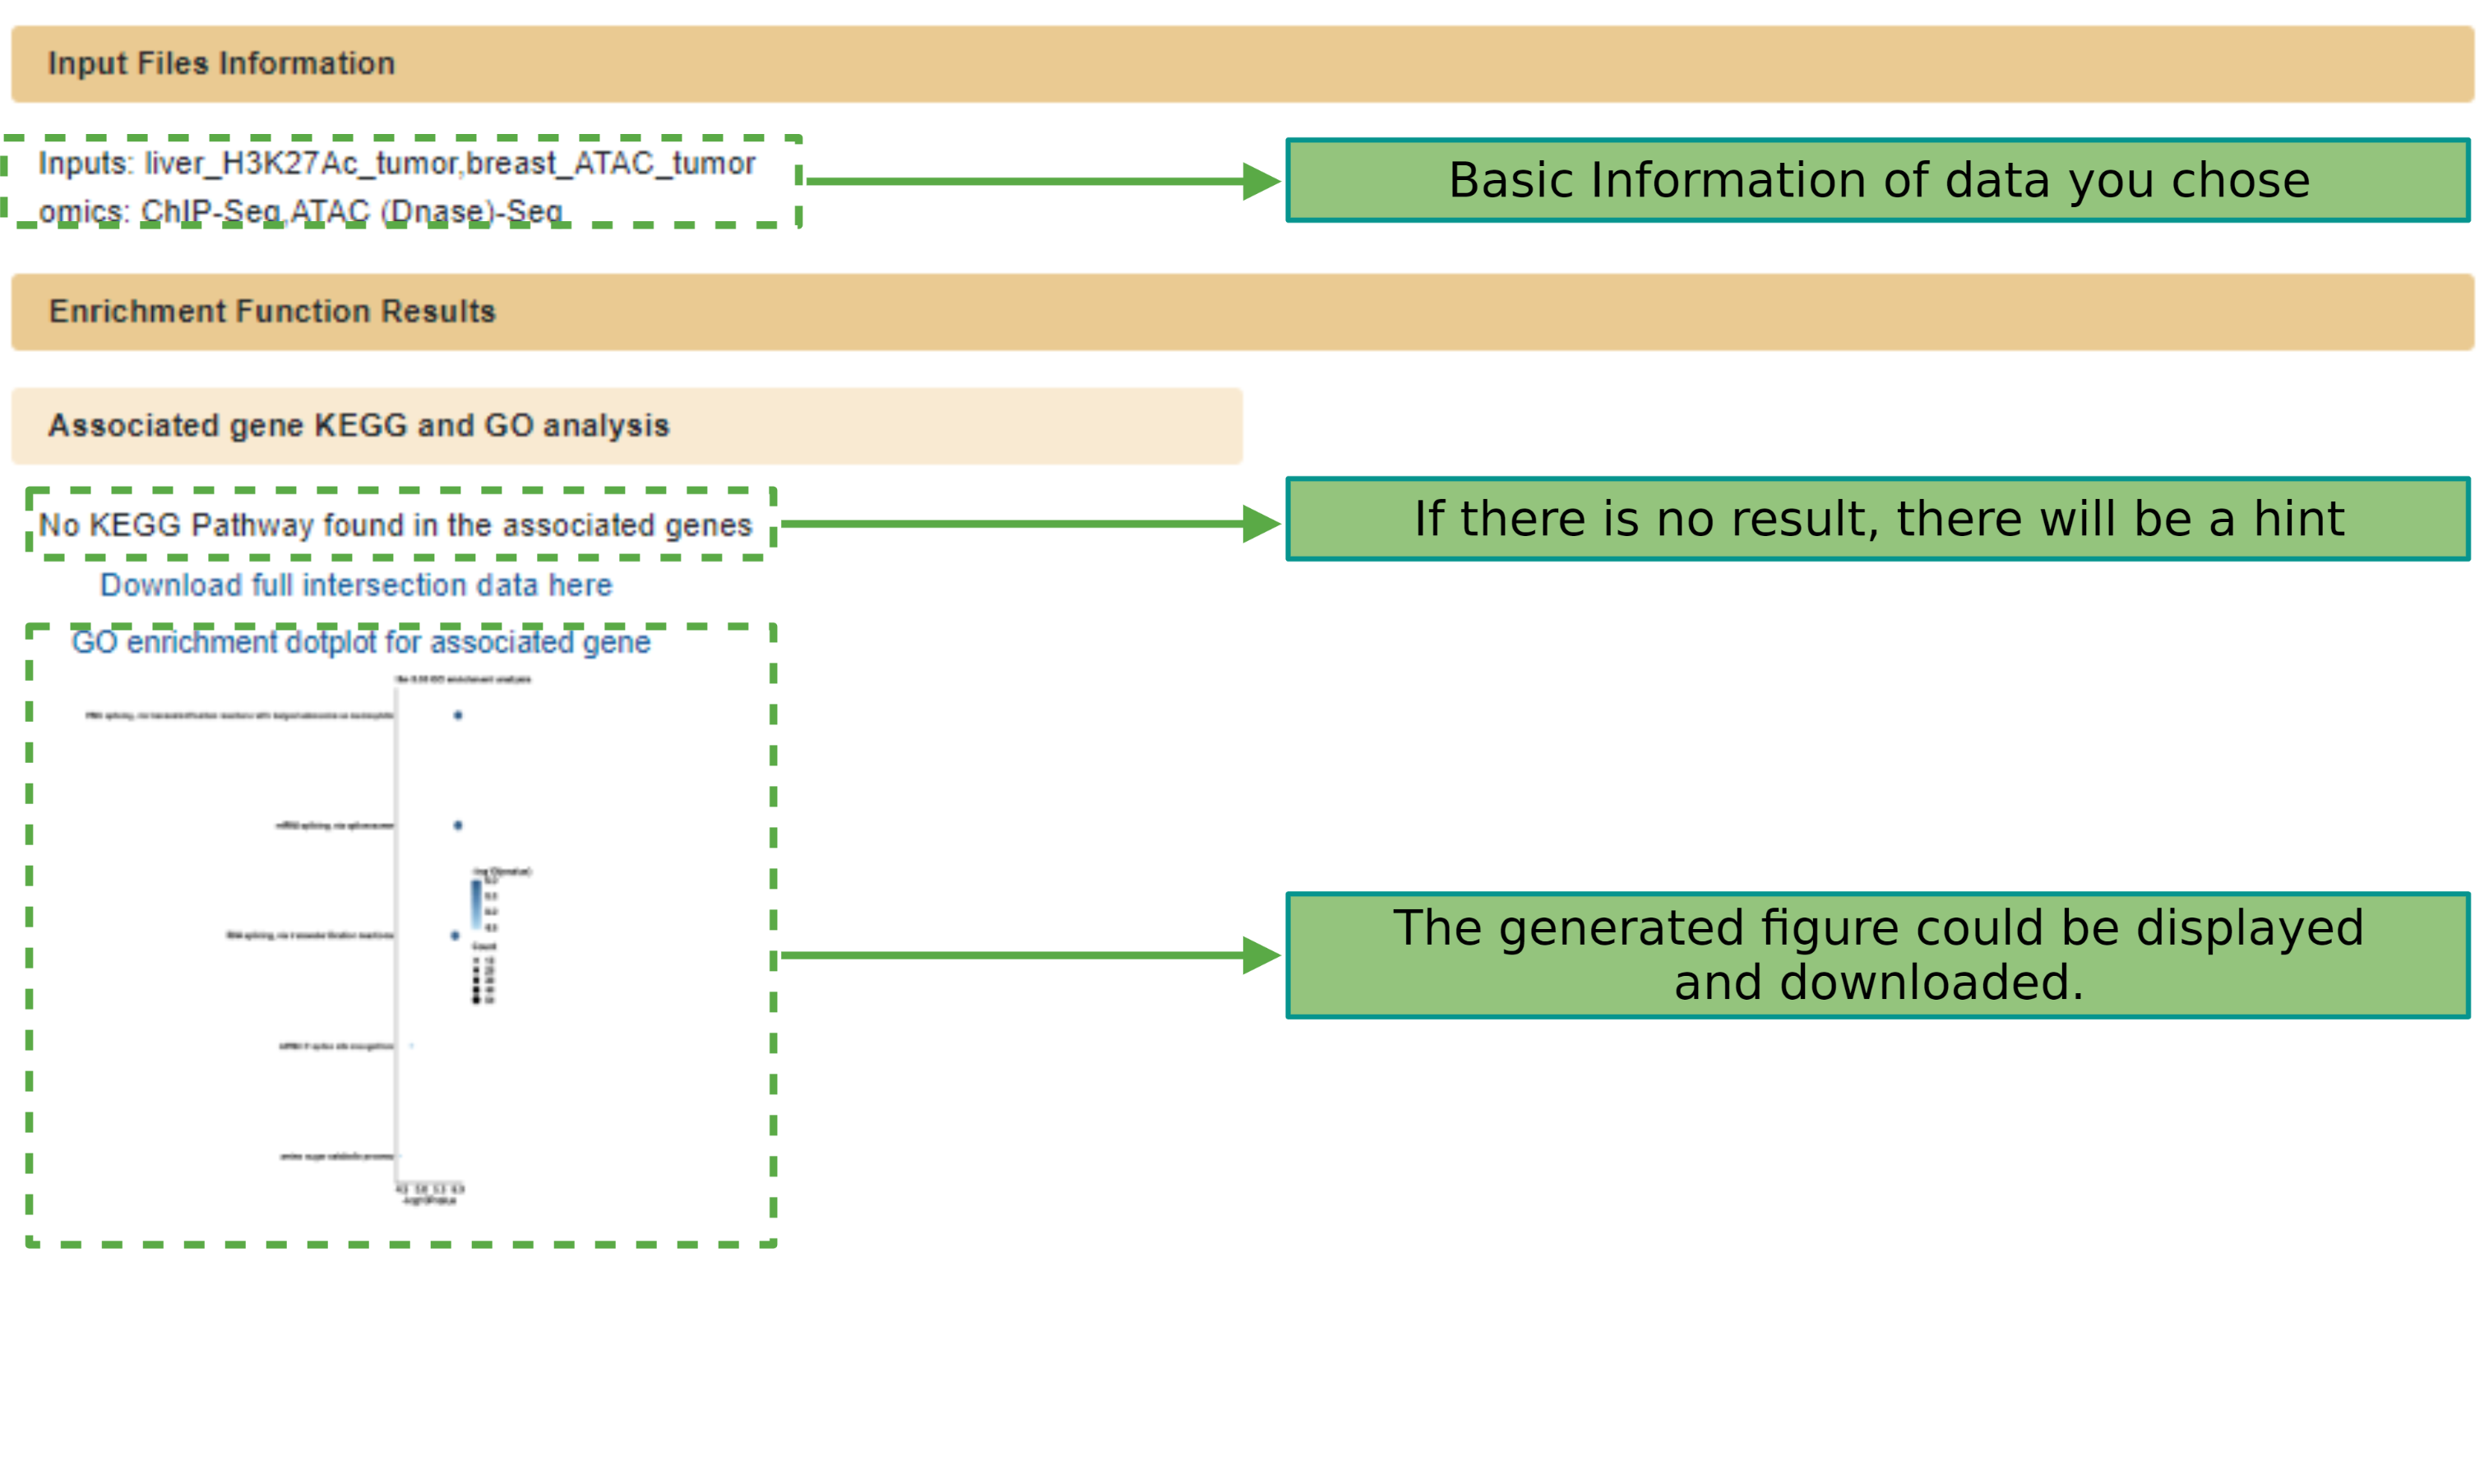
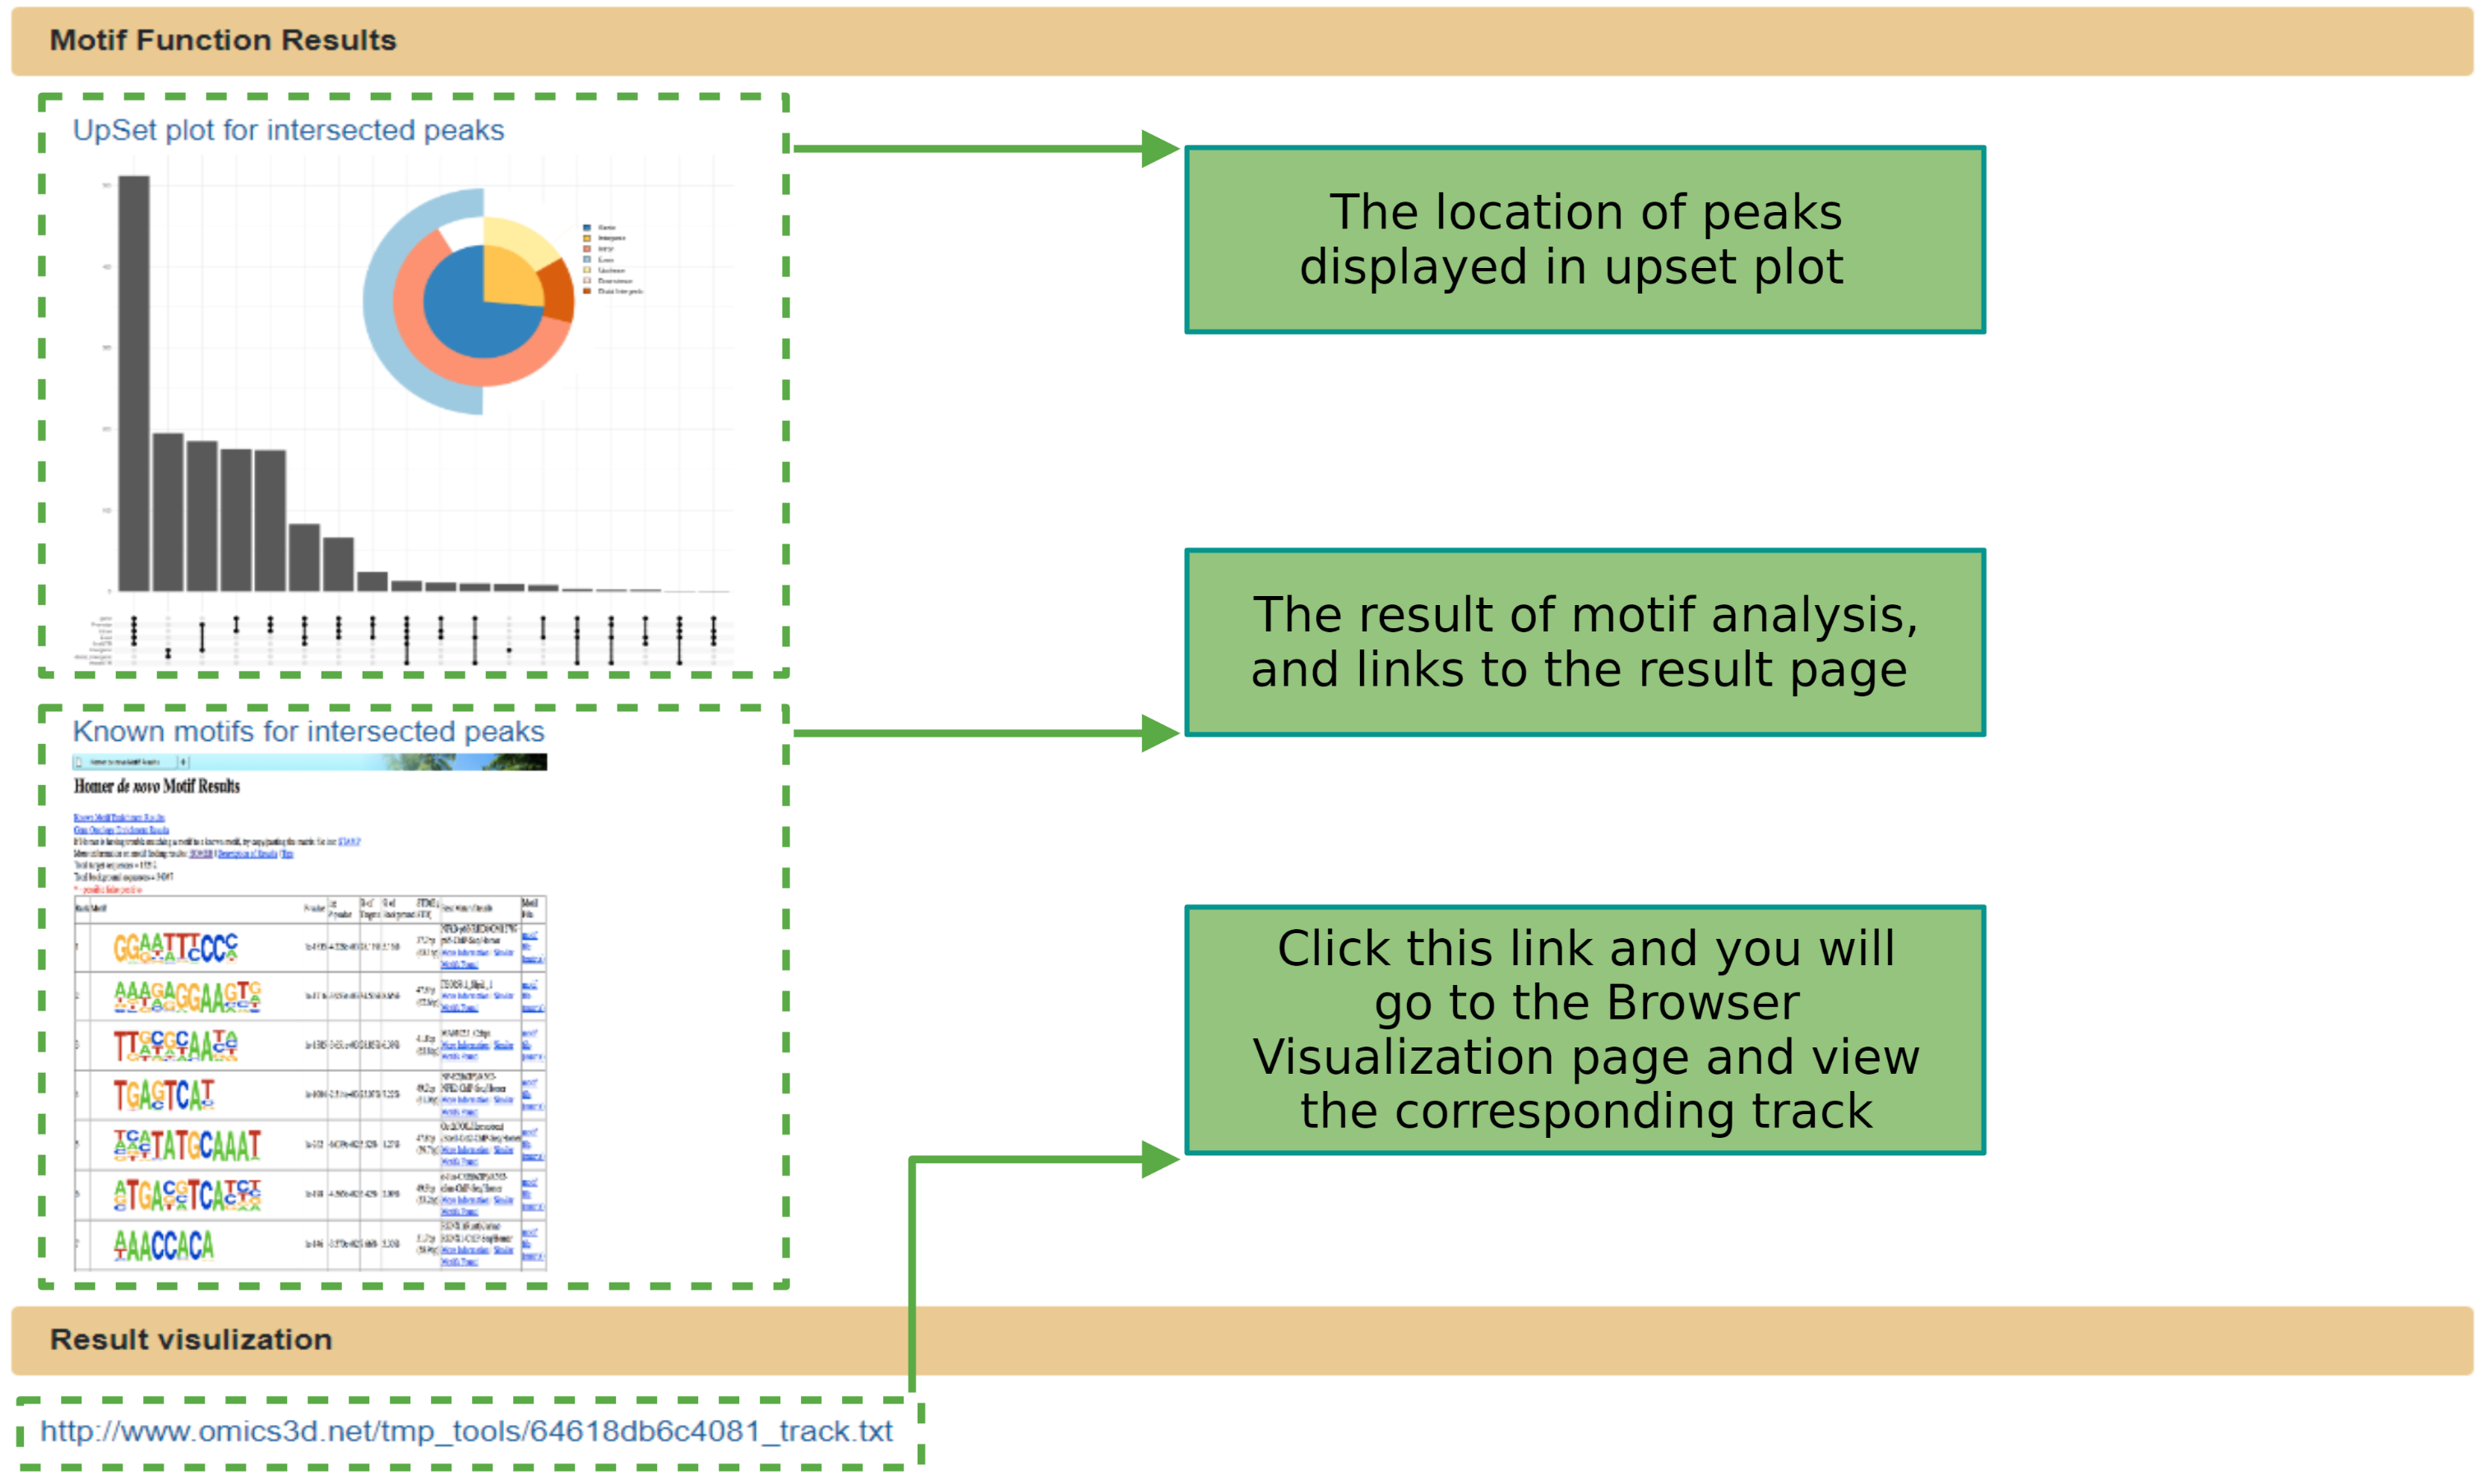

Our platform extends its capabilities beyond human genomics. It includes nine common species in three-dimensional genomics reAnalysis. This expansion not only broadens the scope of our reAnalysis but also enhances the understanding of non-coding DNA in a wider biological context.

Currently, our Omics3D provided a genome broswer based on IGV to visualize the data in our database.
Users can also upload their own data for visualization.

The shown track could be reset to display in different mode, and users can adjust according to their own needs.

We pre-generated amounts of whole genome multi-omics data for each cancer type on three different strategies. You can click "Go" to the corresponding guidance page.
Click on the data that you are interested in; the download will start automatically. Besides, correlated figures including heatmaps, Venn plots and other images representing the analysis results were also showed. By clicking on the available figures, the user can zoom in to view the corresponding image or download the image.

The master tables include a summary of the multiple omics annotations in the genomic regions of cancer embedded in Omics3D and the annotations of known regulatory elements. Users can select the most suitable functional genomic regions from the full range of genes.

GO & KEGG
YouTube: https://youtu.be/2UE7xrGcCRs Bilibili: https://www.bilibili.com/video/BV1eN411C7V8/?spm_id_from=333.999.0.0
Motif
YouTube: https://youtu.be/_8ZihWfAmWs Bilibili: https://www.bilibili.com/video/BV1QP411D7JR/?spm_id_from=333.999.0.0
Position UpSet
YouTube: https://youtu.be/_ADwgoPBWSQ Bilibili: https://www.bilibili.com/video/BV1XN411C7Lf/?spm_id_from=333.999.0.0
Gene UpSet
YouTube: https://youtu.be/d5ZS7SA5doE Bilibili: https://www.bilibili.com/video/BV1Am4y1t79k/?spm_id_from=333.999.0.0
Gene Expression Heatmap
YouTube: https://youtu.be/dWPD_As2Q-w Bilibili: https://www.bilibili.com/video/BV1Jc41137oc/?spm_id_from=333.999.0.0
Volcano Plot
YouTube: https://youtu.be/_FUeh-RQ_To Bilibili: https://www.bilibili.com/video/BV1rV4y1U7Ua/?spm_id_from=333.999.0.0
Peak Heatmap
YouTube: https://youtu.be/T_PUcaH5bgk Bilibili: https://www.bilibili.com/video/BV1RN411C77Y/?spm_id_from=333.999.0.0
Venn Plot
YouTube: https://youtu.be/rMpWpVTEe_4 Bilibili: https://www.bilibili.com/video/BV1ch4y1o7bB/?spm_id_from=333.999.0.0

The start page of Repository has two sections. Analysis section provides a data summary of the database about organs and omics. All peaks are shown in the Result section. Users can filter the peaks by filling arbitrary conditions and clicking submit. If users have no idea about the input format, they can click the Example button for guidance.
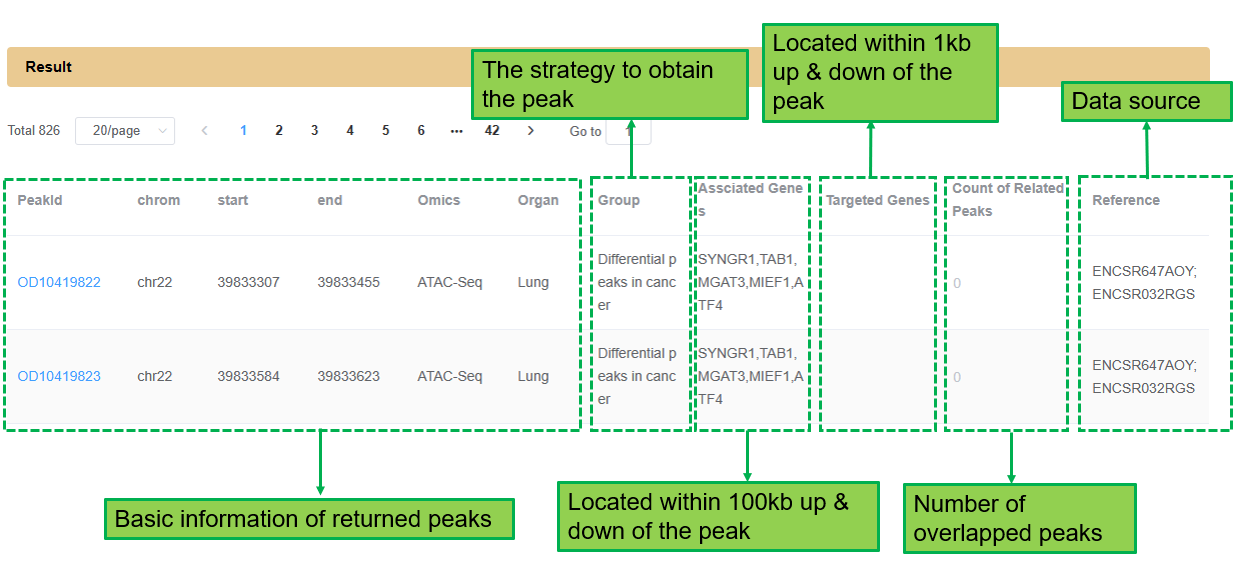
The Result section shows key information of each peak. All peaks of each omics and organ are listed here by default. Besides basic information, the Result section also provides the strategy to obtain each peak, the genes within/associated with the peaks, and the number of overlapped peaks for users to preview peaks. Users can click the peakid for detailed information and analysis.

The Description page of each peak has three sections: Basic information section provides the basic information of the selected peaks. Additionally, this section generates a link of each associated gene or targeted gene. Users can click their interested gene symbol to go to the gene card page of that gene for further
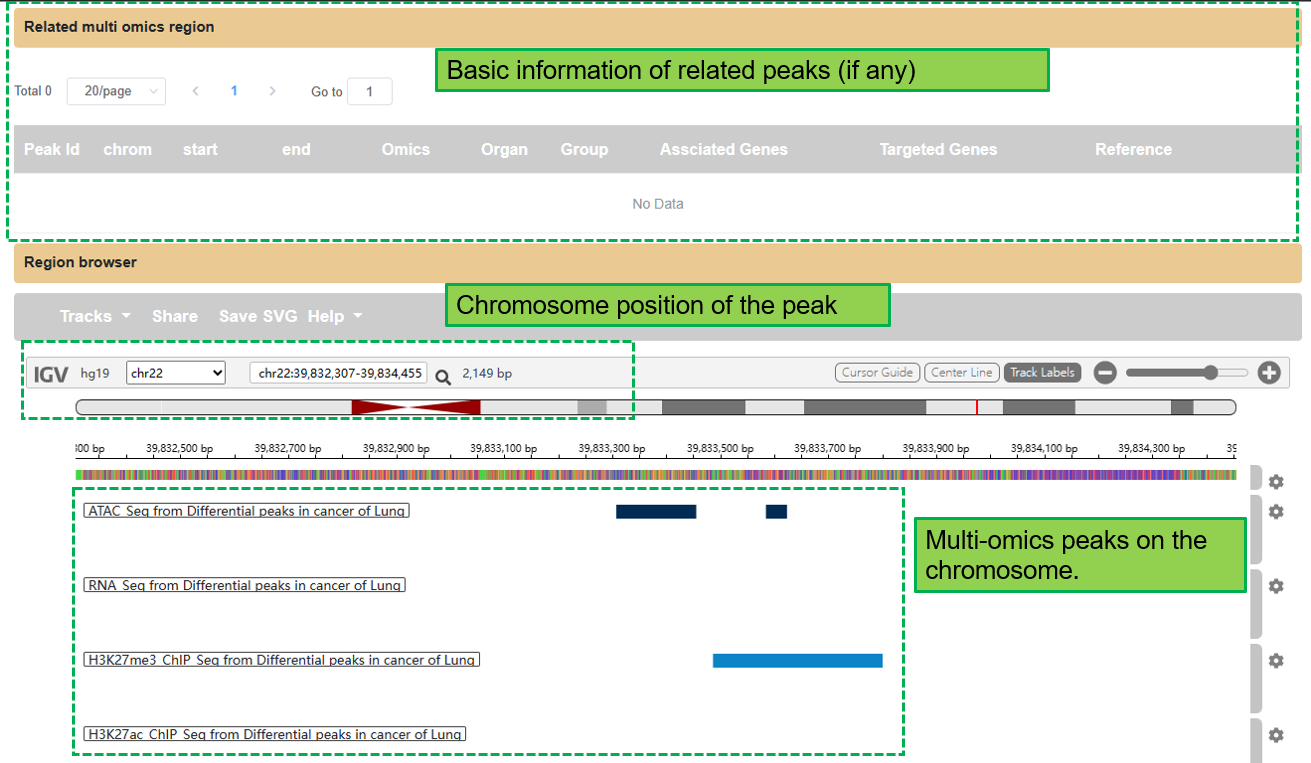
The Related multi omics region section provides similar information of related peaks. Region browser shows all available peaks on the same chromosome position of the selected peak by default. Only peaks under the same organs and groups will be returned.
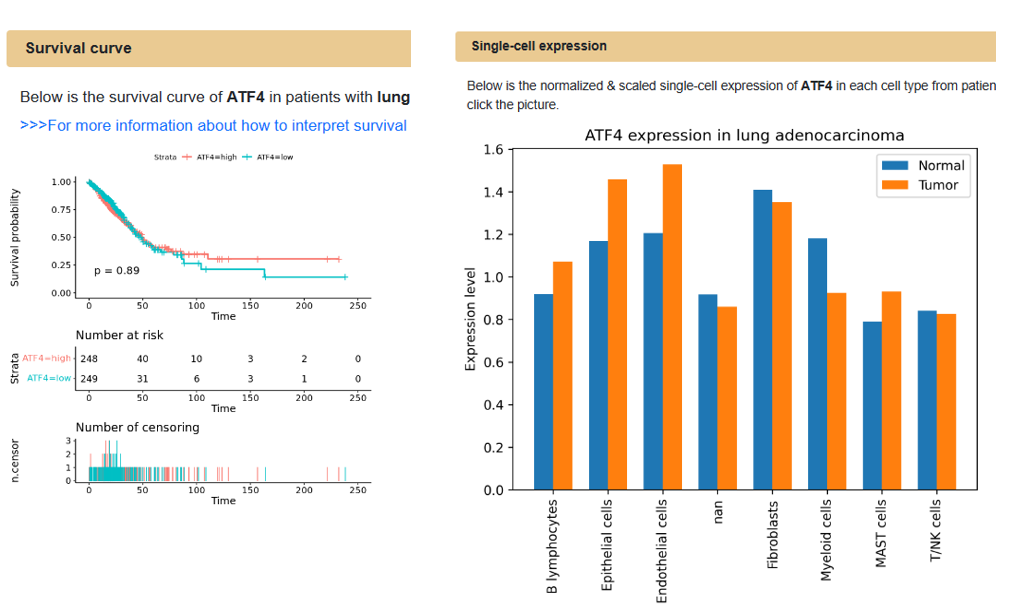
If the user clicks the link of one gene in the associated genes or targeted genes, the Omics3D will return a gene card page including three sections: Survival curve, Single-cell expression and Region browser. Users can check the survival curve and single-cell expression of the interested gene. Users can also visualize the multi-omics peaks in that position of gene. All analyses and results shown are under the same organ and strategy of the peak where the user go from.

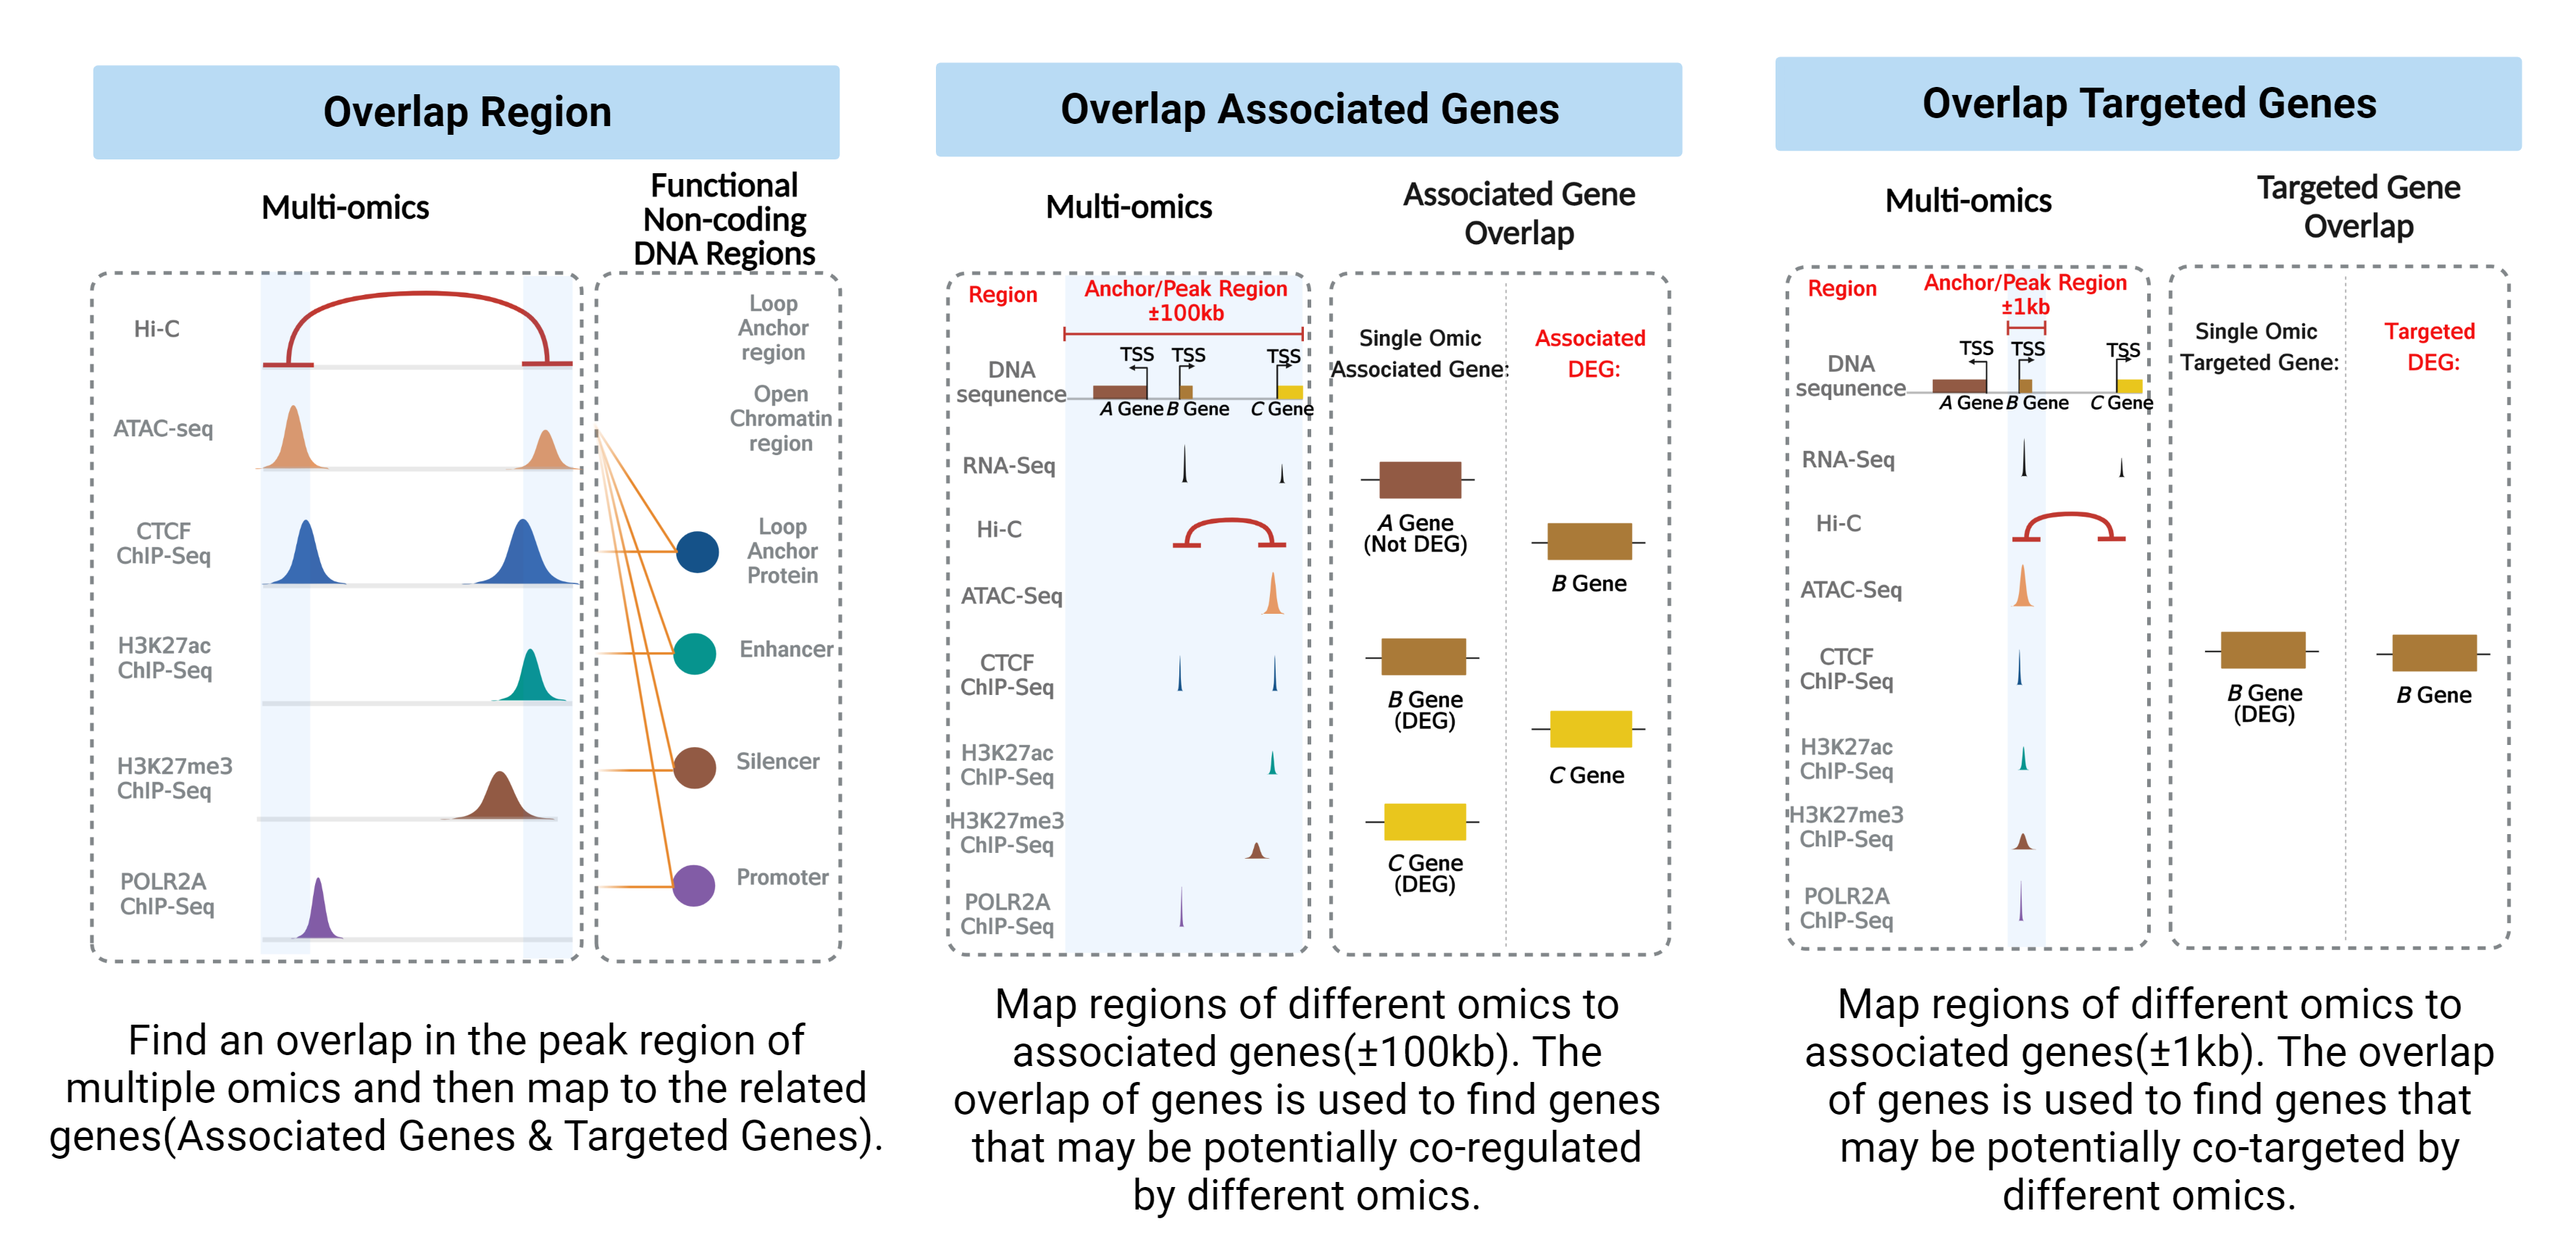
Overlap strategy
Our platform extends its capabilities beyond human genomics. It includes nine common species in three-dimensional genomics reAnalysis. This expansion not only broadens the scope of our reAnalysis but also enhances the understanding of non-coding DNA in a wider biological context.
Contact us
- 0571-87572325
- JianL@intl.zju.edu.cn
- Room A412, Zhejiang University - University of Edinburgh Institute

